New York's 2nd congressional district
| New York's 2nd congressional district | |||
|---|---|---|---|
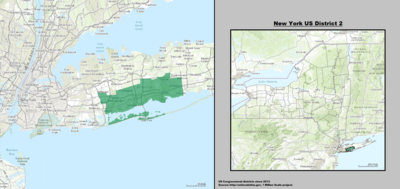 New York's 2nd congressional district since January 3, 2013 | |||
| Representative |
| ||
| Distribution |
| ||
| Population (2019) | 698,974[1] | ||
| Median household income | $108,725[2] | ||
| Ethnicity |
| ||
| Cook PVI | R+3[3] | ||
New York's 2nd congressional district is a congressional district for the United States House of Representatives. Republican Andrew Garbarino has been the representative for the district since 2021.
The congressional district is on Long Island, New York.
Voting
[change | change source]| Election results from presidential races | ||
|---|---|---|
| Year | Office | Results |
| 1992 | President | Bush 40–40% |
| 1996 | President | Clinton 54–34% |
| 2000 | President | Gore 57–39% |
| 2004 | President | Kerry 53–45% |
| 2008 | President | Obama 51–48% |
| 2012 | President | Obama 52–47% |
| 2016 | President | Trump 53–44% |
| 2020 | President | Trump 51–47% |
List of members representing the district
[change | change source]1789–1805: one seat
[change | change source]| Representative | Party | Years | Cong ress |
Electoral history |
|---|---|---|---|---|
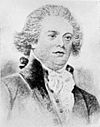 John Laurance |
Pro-Administration | March 4, 1789 – March 3, 1793 |
1st 2nd |
Elected in 1789. Re-elected in 1790. Retired. |
 John Watts |
Pro-Administration | March 4, 1793 – March 3, 1795 |
3rd | Elected in 1793. Lost re-election. |
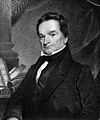 Edward Livingston |
Democratic- Republican |
March 4, 1795 – March 3, 1801 |
4th 5th 6th |
Elected in 1794. Re-elected in 1796. Re-elected in 1798. [Data unknown/missing.] |
 Samuel L. Mitchill |
Democratic- Republican |
March 4, 1801 – March 3, 1803 |
7th | Elected in 1800. Redistricted to the 3rd district. |
 Joshua Sands |
Federalist | March 4, 1803 – March 3, 1805 |
8th | Elected in 1802. Retired. |
1805–1809: Two seats on general ticket with 3rd district
[change | change source]| Cong ress |
Years | Seat A | Seat B | ||||||
|---|---|---|---|---|---|---|---|---|---|
| Representative | Party | Electoral history | Representative | Party | Electoral history | ||||
| 9th 10th |
March 4, 1805 – March 3, 1809 |
Gurdon S. Mumford | Democratic- Republican |
Daniel D. Tompkins was elected in 1804 but declined the seat when appointed to the New York Supreme Court. Elected to begin Tompkins's term. Re-elected in 1806. |
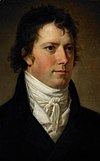 George Clinton Jr. |
Democratic- Republican |
Samuel L. Mitchill (previously of the 3rd district) was re-elected in 1804 but resigned November 22, 1804 when elected U.S. Senator. Elected to begin Mitchell's term. Re-elected in 1806. The districts were separated again, and a second seat was added to the 2nd district. | ||
The districts were separated in 1809.
1809–1823: two seats
[change | change source]From 1809 to 1823, two seats were apportioned to the second district, elected at-large on a general ticket.
| Cong ress |
Years | Seat A | Seat B | ||||||
|---|---|---|---|---|---|---|---|---|---|
| Representative | Party | Electoral history | Representative | Party | Electoral history | ||||
| 11th | March 4, 1809 – 1810 |
Gurdon S. Mumford | Democratic-Republican | Re-elected in 1808. [Data unknown/missing.] |
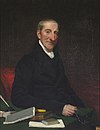 William Denning |
Democratic-Republican | Elected in 1808. Never took his seat resigned. | ||
| 1810 – December 4, 1810 |
Vacant | ||||||||
| December 4, 1810 – March 3, 1811 |
 Samuel L. Mitchill |
Democratic-Republican | Elected April 24–26, 1810 to finish Denning's term and seated December 4, 1810. Also elected the same day in 1810 to the next term. [Data unknown/missing.] | ||||||
| 12th | March 4, 1811 – March 3, 1813 |
 William Paulding Jr. |
Democratic-Republican | Elected in 1810. [Data unknown/missing.] | |||||
| 13th | March 4, 1813 – August 2, 1813 |
 Egbert Benson |
Federalist | Elected in 1812. Resigned. |
Jotham Post Jr. | Federalist | Elected in 1812. [Data unknown/missing.] | ||
| August 2, 1813 – January 22, 1814 |
Vacant | ||||||||
| January 22, 1814 – March 3, 1815 |
William Irving | Democratic-Republican | Elected December 28–30, 1813 to finish Benson's term and was seated January 22, 1814. Re-elected in 1814. Re-elected in 1816. [Data unknown/missing.] | ||||||
| 14th | March 4, 1815 – March 3, 1817 |
Peter H. Wendover | Democratic-Republican | Elected in 1814. Re-elected in 1816. Re-elected in 1818. [Data unknown/missing.] | |||||
| 15th | March 4, 1817 – March 3, 1819 | ||||||||
| 16th | March 4, 1819 – March 3, 1821 |
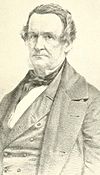 Henry Meigs |
Democratic-Republican | Elected in 1818. [Data unknown/missing.] | |||||
| 17th | March 4, 1821 – December 3, 1821 |
Elections were held in April 1821. It is unclear when results were announced or credentials issued. | |||||||
| December 3, 1821 – March 3, 1823 |
 Churchill C. Cambreleng |
Democratic-Republican | Elected in 1821. Redistricted to the 3rd district. |
John J. Morgan | Democratic-Republican | Elected in 1821. Redistricted to the 3rd district. | |||
1823–present: one seat
[change | change source]Recent election results
[change | change source]New York election law allows for fusion voting, where a candidate can run as a member of multiple parties. The pooled vote totals for candidates are listed first, and the split of the votes among the parties they ran as is listed beneath. See below for blank, void, and scattering notes.*
| Year | Democrat | Votes | Pct | Republican | Votes | Pct | 3rd Party | Party | Votes | Pct | ||||||||||
|---|---|---|---|---|---|---|---|---|---|---|---|---|---|---|---|---|---|---|---|---|
| 2000 | 90,438 | 48% | Joan B. Johnson | 65,880 | 35% | Robert Walsh | Right to Life | 11,224 | 6% | |||||||||||
| Democratic | 90,438 | Republican | 65,880 | Richard N. Thompson | Conservative | 10,824 | 6% | |||||||||||||
| David A. Bishop | 10,266 | 5% | ||||||||||||||||||
| Independence | 7,595 | |||||||||||||||||||
| Green | 1,404 | |||||||||||||||||||
| Working Families | 1,267 | |||||||||||||||||||
| 2002 | 85,451 | 58% | Joseph P. Finley | 59,117 | 40% | John Keenan | Green | 1,558 | 1% | |||||||||||
| Democratic | 75,845 | Republican | 48,239 | |||||||||||||||||
| Independence | 7,632 | Conservative | 5,772 | |||||||||||||||||
| Working Families | 1,974 | Right to Life | 5,106 | |||||||||||||||||
| 2004 | 161,593 | 67% | Richard Hoffmann | 80,950 | 33% | |||||||||||||||
| Democratic | 147,197 | Republican | 72,953 | |||||||||||||||||
| Independence | 9,508 | Conservative | 7,997 | |||||||||||||||||
| Working Families | 4,888 | |||||||||||||||||||
| 2006 | 105,276 | 70% | John W. Bugler | 44,212 | 30% | |||||||||||||||
| Democratic | 94,100 | Republican | 37,671 | |||||||||||||||||
| Independence | 7,443 | Conservative | 6,541 | |||||||||||||||||
| Working Families | 3,733 | |||||||||||||||||||
| 2008 | 161,279 | 67% | Frank J. Stalzer | 79,641 | 33% | |||||||||||||||
| Democratic | 143,759 | Republican | 70,145 | |||||||||||||||||
| Independence | 11,900 | Conservative | 9,496 | |||||||||||||||||
| Working Families | 5,620 | |||||||||||||||||||
| 2010 | 94,694 | 56% | John Gomez | 72,115 | 43% | Anthony Tolda | CST | 1,258 | 1% | |||||||||||
| Democratic | 84,211 | Republican | 53,747 | |||||||||||||||||
| Independence | 6,353 | Conservative | 13,525 | |||||||||||||||||
| Working Families | 4,130 | |||||||||||||||||||
| 2012 | Vivianne Falcone | 92,060 | 41% | 131,091 | 59% | |||||||||||||||
| 2014 | Patricia Maher | 40,009 | 28% | 91,701 | 65% | |||||||||||||||
| 2016 | Du Wayne Gregory | 110,938 | 38% | 181,506 | 62% | |||||||||||||||
| 2018 | Liuba Grechen Shirley | 106,996 | 45% | 122,103 | 53% | |||||||||||||||
| Democratic | 102,977 | Republican | 107,495 | |||||||||||||||||
| Women's Equality | 1,371 | Conservative | 11,742 | |||||||||||||||||
| Working Families | 2,648 | Independence | 2,417 | |||||||||||||||||
| 2020 | Jackie Gordon | 154,123 | 46% | 177,353 | 53% | Harry Burger | Green | 3,446 | 1% | |||||||||||
* Blank, void, and write-in candidate ("scattering") notes: In 2000, there were 37,596 BVS votes; in 2002, 14,087; in 2004, 40,937; and in 2006, 14,101. Since 2008, results were separated out, and there were 54,163 blank votes; 10 void ballots; and 12 votes cast for write-in candidates. In 2010, 7,104 were blank votes; 93 were void ballots; and thirty were votes cast for write-in candidates.
References
[change | change source]- ↑ "New York congressional districts by urban and rural population and land area". United States Census Bureau. June 8, 2017. Archived from the original on November 21, 2019. Retrieved November 21, 2019.
- ↑ My Congressional District
- ↑ "Partisan Voting Index – Districts of the 115th Congress" (PDF). The Cook Political Report. April 7, 2017. Archived from the original (PDF) on June 7, 2017. Retrieved April 7, 2017.
- ↑ Parsons, Stanley B.; Dubin, Michael J.; Parsons, Karen Toombs (1990). United States Congressional Districts, 1883-1913. p. 89. ISBN 9780313264825.
- ↑ Parsons, Stanley B.; Dubin, Michael J.; Parsons, Karen Toombs (1990). United States Congressional Districts, 1883-1913. p. 247. ISBN 9780313264825.
- ↑ Parsons, Stanley B.; Dubin, Michael J.; Parsons, Karen Toombs (1990). United States Congressional Districts, 1883-1913. p. 382. ISBN 9780313264825.
- ↑ "Election Statistics". Office of the Clerk of the House of Representatives. Retrieved 2008-01-10.
- ↑ "New York State Board of Elections 2008 Election Results page". Archived from the original on 2012-01-12. Retrieved 2021-03-03.
- ↑ "New York State Board of Elections 2010 Election Results page". Archived from the original on 2012-01-08. Retrieved 2021-03-03.


