Division of Perth
| Perth Australian House of Representatives Division | |
|---|---|
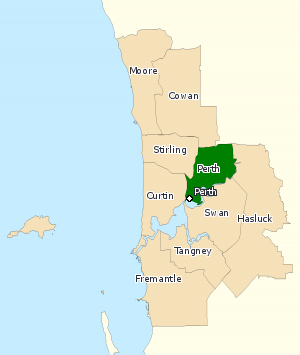
 Division of Perth (green) in Western Australia | |
| Created | 1901 |
| MP | Patrick Gorman |
| Party | Labor |
| Namesake | Perth |
| Electors | 95,226 (2013) |
| Area | 78 km2 (30.1 sq mi) |
| Demographic | Inner Metropolitan |
The Division of Perth is an Australian electoral division in Western Australia. It was one of the first 75 divisions set up for the first Australian election in 1901.[1] It is named after Perth, the capital city of Western Australia.
It includes the suburbs of Ashfield, Bassendean, Bayswater, Bedford, Beechboro, East Perth, Eden Hill, Embleton, Highgate, Inglewood, Kiara, Lockridge, Maylands, Morley, Mount Lawley, Noranda, Northbridge, and parts of Coolbinia, Dianella, Menora, North Perth, Perth City, West Perth and Yokine.[1]
Members
[change | change source]| Member | Party | Term | |
|---|---|---|---|
| James Fowler | Labor | 1901–1909 | |
| Commonwealth Liberal | 1909–1917 | ||
| Nationalist | 1917–1922 | ||
| Edward Mann | Nationalist | 1922–1929 | |
| Independent Nationalist | 1929–1929 | ||
| Walter Nairn | Nationalist | 1929–1931 | |
| United Australia | 1931–1943 | ||
| Tom Burke | Labor | 1943–1955 | |
| Fred Chaney | Liberal | 1955–1969 | |
| Joe Berinson | Labor | 1969–1975 | |
| Ross McLean | Liberal | 1975–1983 | |
| Ric Charlesworth | Labor | 1983–1993 | |
| Stephen Smith | Labor | 1993–2013 | |
| Alannah MacTiernan | Labor | 2013–present | |
Walter Nairn was Speaker of the Australian House of Representatives from 1940 to 1943. Tom Burke's son, Brian Burke, became Premier of Western Australia. Fred Chaney Snr. was Minister for the Navy in the Menzies and Holt governments. He was later appointed as Administrator of the Northern Territory. One of his sons, also named Fred Chaney, became a Member of Parliament. Joe Berinson served as Minister of the Environment in the Whitlam government. Ric Charlesworth was a hockey player, who played for Australia at five Olympic Games. Steven Smith served in the Rudd and Gillard governments as a minister, includuing Foreign Affairs, Trade, and Defence.
Election results
[change | change source]| 2022 Australian federal election: Perth[2] | |||||
|---|---|---|---|---|---|
| Party | Candidate | Votes | % | ±% | |
| Labor | Patrick Gorman | 40,066 | 39.25 | +5.66 | |
| Liberal | David Dwyer | 27,294 | 26.74 | −12.24 | |
| Greens | Caroline Perks | 22,621 | 22.16 | +3.79 | |
| One Nation | Cameron Bailey | 2,749 | 2.69 | −0.03 | |
| Western Australia | Dave Vos | 1,878 | 1.84 | −0.57 | |
| United Australia | Sonya Eberhart | 1,605 | 1.57 | −0.23 | |
| Animal Justice | Sarah Szmekura-Moor | 1,535 | 1.50 | +1.50 | |
| Christians | Dean Powell | 1,514 | 1.48 | +1.09 | |
| Liberal Democrats | Evan Nickols | 1,407 | 1.38 | +1.38 | |
| Australian Federation | Aiden Gyuru | 710 | 0.70 | +0.70 | |
| Great Australian | Sean Connor | 702 | 0.69 | +0.69 | |
| Total formal votes | 102,081 | 94.42 | −1.20 | ||
| Informal votes | 6,028 | 5.58 | +1.20 | ||
| Turnout | 108,109 | 88.19 | −1.34 | ||
| Two-party-preferred result | |||||
| Labor | Patrick Gorman | 66,151 | 64.80 | +11.57 | |
| Liberal | David Dwyer | 35,930 | 35.20 | −11.57 | |
| Labor hold | Swing | +11.57 | |||
References
[change | change source]- ↑ 1.0 1.1 "Profile of the electoral division of Perth (WA)". Australian Electoral Commission. 2015. Retrieved 24 January 2015.
- ↑ Perth, WA, 2022 Tally Room, Australian Electoral Commission.